The New Trace View is Generally Available
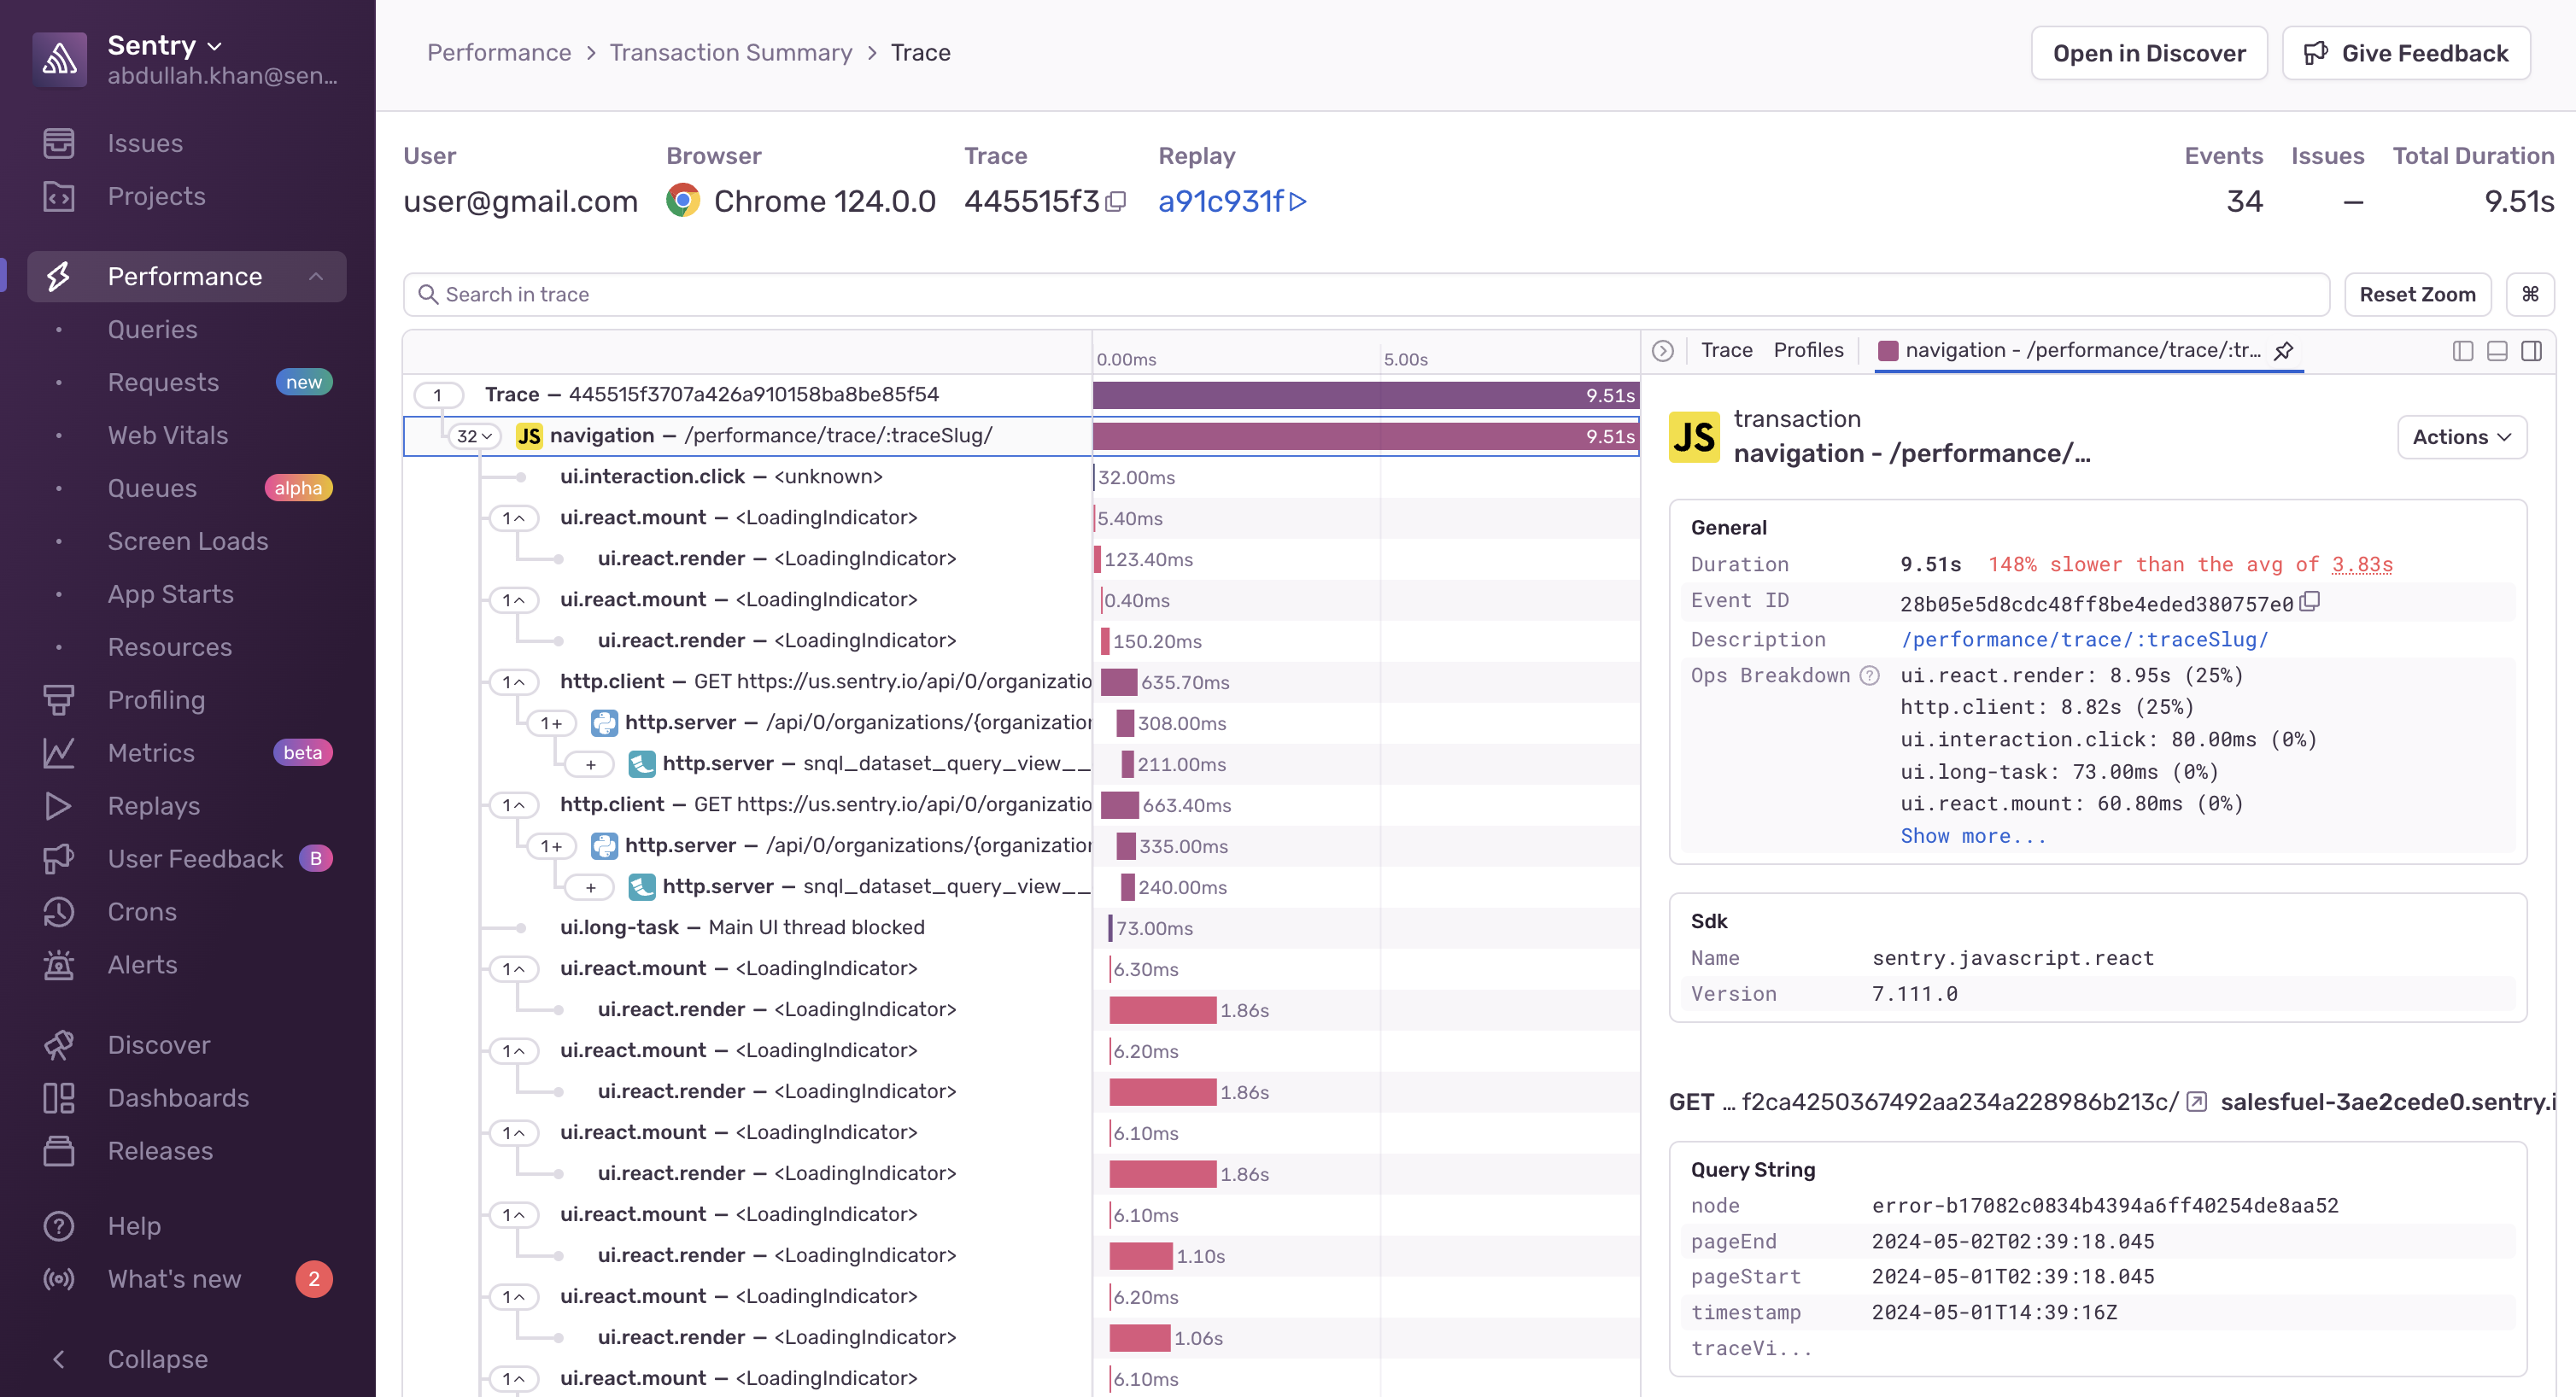
The Trace View is used to debug performance problems and understand how multiple services in your application interact when supporting operations like page loads. The new Trace View replaces the Event Details page. But don't panic. You can still see all your transactions and any associated issues, spans, and profiles within the context of the trace.
We also introduced:
- The ability to zoom into bars in the waterfall view to better understand gaps in the data and preserve the event level perspective that the Event Detail page provided.
- Trace level information including associated issues, web vitals and profiles.
- A trace level search bar that lets you highlight transactions and spans by their properties and easily navigate through the results.
How can you get to the new trace view?
Click on any trace ID or transaction event ID in Sentry to make your way to the trace view.
For more information, see our documentation.